

This article is part of our feature The Politics of Health Equity in Europe.
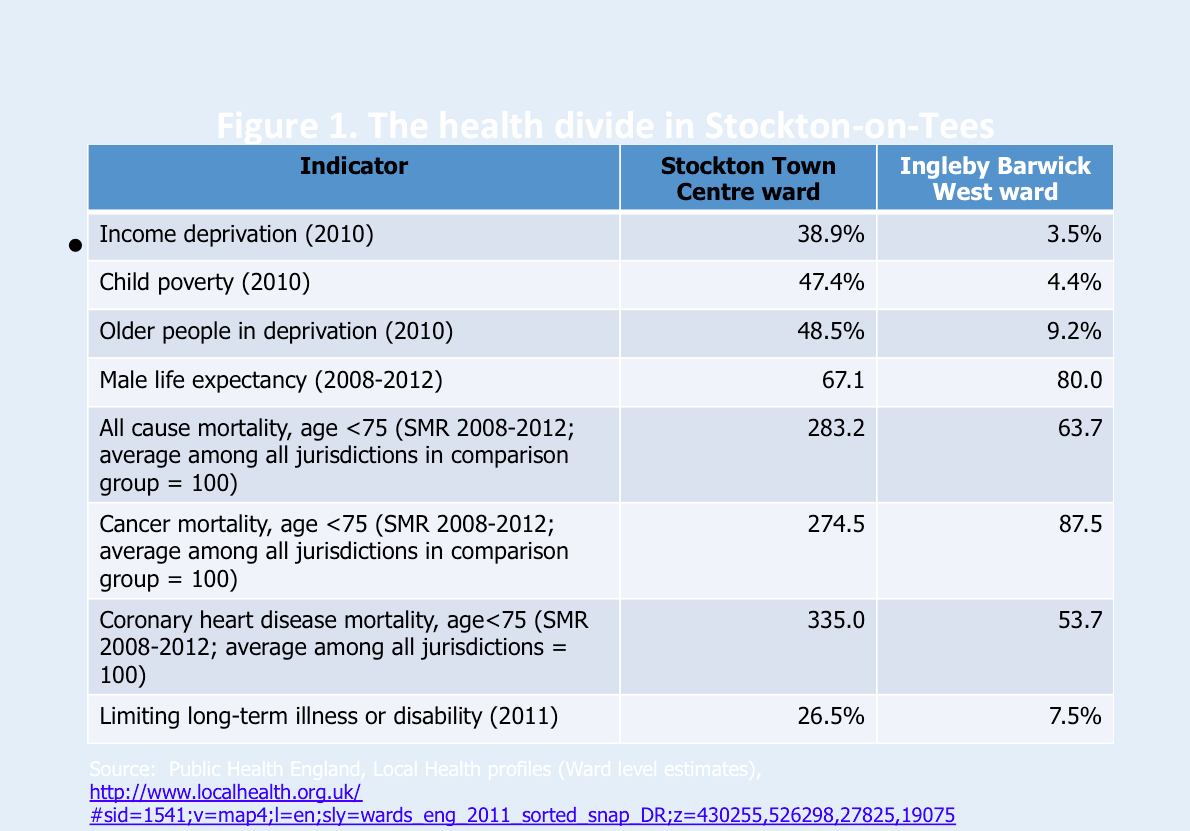
Within the boundaries of the small local authority of Stockton-on-Tees, where I live and work, the difference in life expectancy between Town Centre ward and the suburban, largely new-build ward of Ingleby Barwick West, a few miles away, is 13 years. This is comparable to the difference in national average male life expectancy between the United Kingdom and Pakistan. Estimated using smaller geographical units, lower super output areas (LSOAs) with 1,000-3,000 people, the difference in male life expectancy between the least and most deprived areas in Stockton-on-Tees has grown to 17 years[1]—comparable to the difference in national average male life expectancy between the UK and Senegal. This is the largest such difference within any local authority in England.
Stockton-on-Tees is one of many communities in the North-East of England that was economically devastated by deindustrialization; enclaves of affluence remain, although research on where the money comes from is sadly lacking. From 1997 to 2010, the Labour government made reducing health inequalities a stated objective, with limited success. On some measures, those inequalities actually increased[2] (probably because, with the exception of a successful attack on child poverty,[3] the government did not address the socioeconomic divides that drive those inequalities). Since 2010, and especially since 2013, governments—first a Conservative-led coalition, and since 2015 a Conservative majority—have been systematically scaling back public expenditures that benefit the poor and economically marginalized. Peter Taylor-Gooby has described this process as “root and branch restructuring” of the UK’s economy and society.[4] The effect of expenditure cuts will be to roll back public spending as a proportion of GDP to the levels of the 1930s—that is to say before the establishment of the National Health Service and of postwar mechanisms of social protection: in the words of an Institute for Fiscal Studies briefing, “taking the size of the state to its smallest in many generations.”[5] That course of action is the fundamental barrier to reducing health inequalities, which instead will almost certainly continue to increase.
*
Last year, my colleague Clare Bambra and I argued that health consequences of policies like those pursued by the Conservatives are best described in terms of a number of related “neoliberal epidemics.”[6] We used the term because, at least in countries like the United States and the UK, which have traveled farthest down the neoliberal or “market fundamentalist” road, the negative health impacts exist on such a scale and have spread so quickly across time and space that if they involved pathogens they would be seen as of epidemic proportions.
Indeed, references to the epidemic of overweight and obesity, now convincingly linked to the neoliberal transformation of food systems[7] and the increasing unaffordability of healthy diets,[8] have become commonplace.
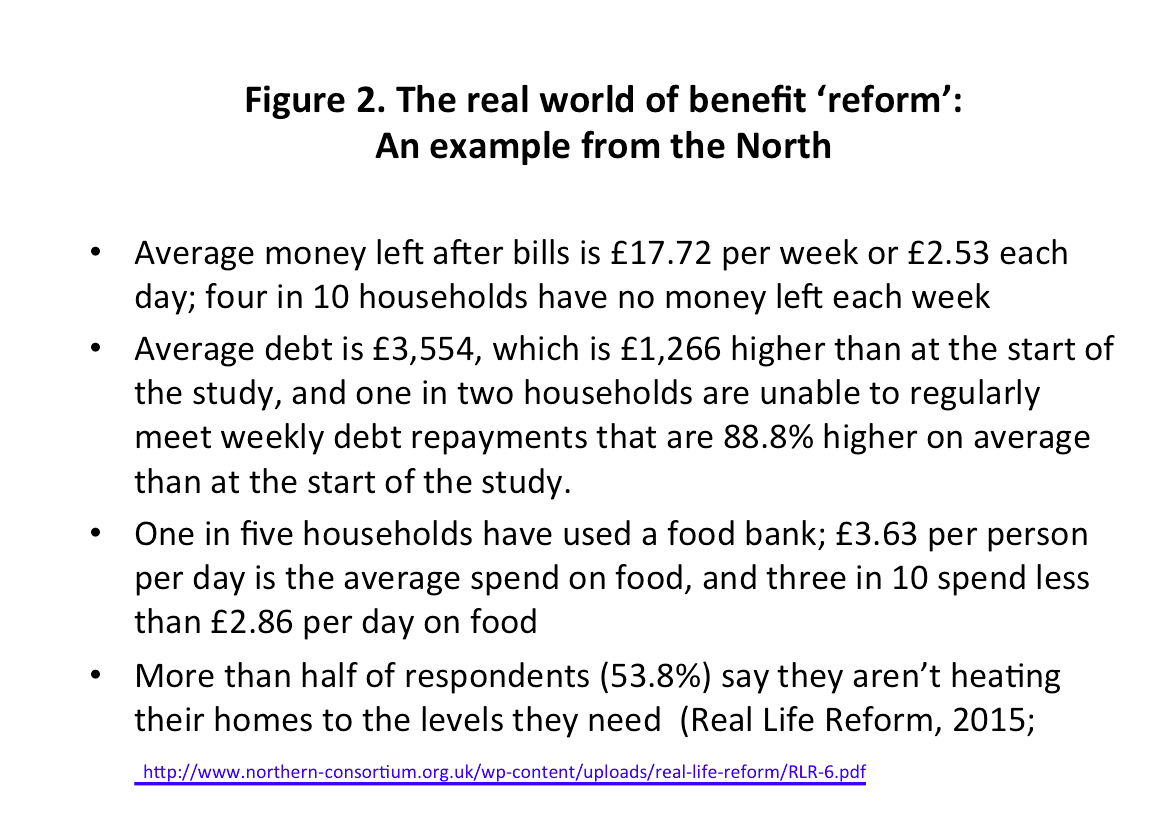
Above and beyond this literature, a large and expanding body of research describes the impact of recent neoliberal policies on social determinants of health in the UK. For example, journalist Mary O’Hara’s remarkable book Austerity Bites combines rigorous academic background research and interviews with people throughout Britain to depict a policy-driven nightmare of food poverty, economic insecurity, and scapegoating of the disabled that makes the book emotionally devastating reading.[9] On a smaller scale, the Real Life Reform Project has followed a sample of households in the North of England affected by the multiple benefit and labor market reforms.[10] Figure 2 shows some highlights from its final report.
It is worth dwelling on food and fuel insecurity. As a result of a combination of falling wages, rising prices, and the erosion of social protection,[11] it is estimated that half a million people relied on some form of food aid (food banks) in 2013-14,
[12] and almost ten times that number—7 million—were estimated to be living in “food poverty.”[13] Alongside food poverty, many households are also experiencing fuel poverty, with journalistic reports suggesting that fuel poverty is one of the influences leading people to take out payday loans at extortionate interest rates to pay for basic necessities,[14] or to resort to survival theft.[15]
In 2012, Sir Michael Marmot and colleagues wrote: “It is hard to see how even ideologically driven commentators could think that having sufficient money to live on is irrelevant to health inequalities.”[16] Sir Michael is a perennial optimist. Consider the fact that in 2009, the House of Commons Health Committee claimed to have “received no compelling evidence to suggest that anybody knows at present what changes” in wider determinants of health “would be most effective at lowering health inequalities”[17] (although it heard, and quoted in its report, evidence on this point from both Marmot and Richard Wilkinson). Perhaps there are no randomized controlled trials; there are none showing the effectiveness of parachutes, either,[18] but surely enabling everyone to afford a healthy diet would be a logical and unquestionably evidence-supported first step. As with the case of parachutes, understanding of the mechanisms of action is sufficient to justify the intervention. A similar analysis can and should be applied to other basic prerequisites for health.
*
Against this background, despite the government’s rhetoric, one thing is very clear about the “root and branch restructuring”[19] that is now under way: we are not all in it together.
Calculations done at the London School of Economics and Political Science found that the combined impact of tax and benefit changes was regressive across the income distribution as a whole: “under most sets of assumptions the main gains were in the upper middle of the income distribution and the main losers were at the bottom and those close to, but not at, the very top.”[20] What gives the game away here is the finding that “the overall effect of the changes,” which were justified in the name of deficit reduction, “had a net fiscal cost, rather than contributing to deficit reduction.”[21] Needless to say, additional cuts are now being justified on a similar basis. The study further concluded that benefit changes anticipated over the coming years “would intensify the distributional effects seen by 2015/16, including increases in the losses of lone parent and large families, children in general and of most of the bottom half of the income distribution.”[22]
Coming on top of an already desperate employment picture in many regions, the effect of welfare reforms has hit not only the poorest people, but also the poorest places, hardest.
Researchers at Sheffield Hallam University estimate that by March 2016, the reforms had taken more than £500 per working age adult per year out of the economies of some local authority areas with high levels of deprivation, but only 40 percent of that amount out of the economies of many affluent areas.[23] By 2020-21, the cumulative impact of all post-2010 reforms is likely to cost the poorest areas more than £1,000 per working age adult per year. According to the researchers: “There is a clear and unambiguous relationship: as a general rule, the more deprived the local authority, the greater the financial hit.”
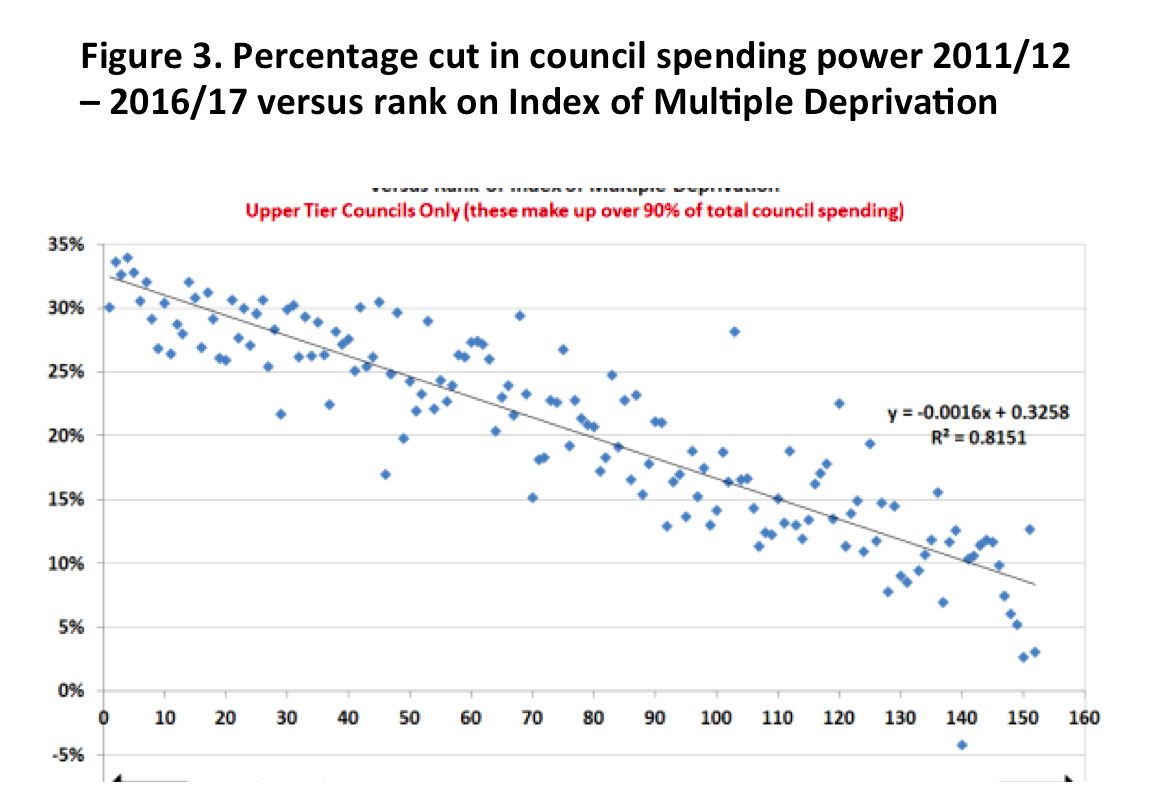
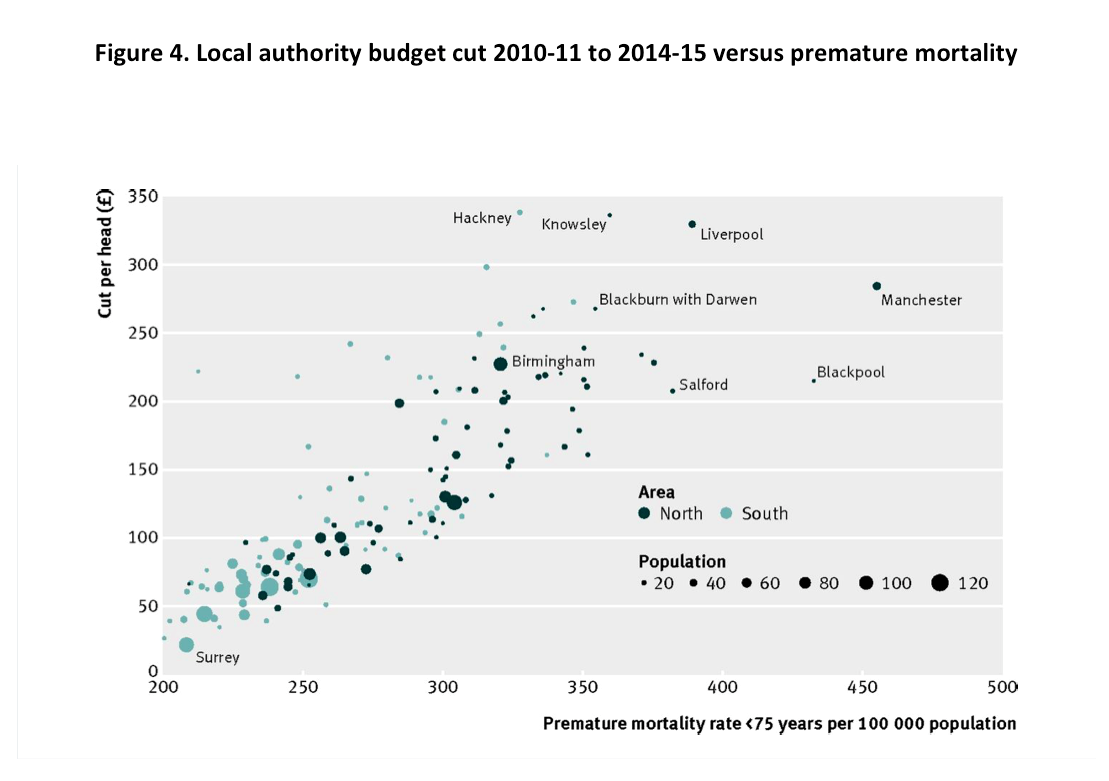
The impacts of this contractionary policy are being compounded by cuts to the budgets of local authorities—the governments that now have statutory responsibility for public health. Figure 3, generated by an official of the trade union UNISON, shows that the more deprived an area, the larger the budget cut its local government has suffered.[24] Researchers at the University of Liverpool have graphed the per capita reduction in local authority budgets (Figure 4) against the rate of premature mortality for every local authority in England, showing that the cuts disproportionately affect not only the poorest regions but also the sickest (and they tend to be the same regions).[25]
It must be kept in mind that some of the regions where these cumulative impacts will fall most heavily are already poorer than any regions in France, Germany, Belgium, the Netherlands, Luxembourg, Austria, Ireland, Denmark, Finland, and Sweden.[26] Even The Economist described the impact on once-prosperous industrial cities as “brutal,” although its response was to call for a policy of selective abandonment.[27]
An important recent article by Jeremy Green and Scott Lavery makes the point that austerity measures are being implemented while real wages are stagnating or declining.[28] The spread of low-wage, insecure, and precarious employment reflects labor market restructuring that dates back to the 1980s, as well as more recent initiatives designed to force the unemployed into the labor market “irrespective of the quality of the work on offer,” as the authors point out. They also remind us that expenditure cuts have a direct labor market impact, with an estimated one million public sector jobs lost between the start of the financial crisis and the end of 2015. Once again, the impacts are falling disproportionately on poorer regions where the public sector is relatively more important as an employer, and on women, who are estimated to have bore as much as 85 percent of the impact of tax and benefit changes from 2010 through 2014.[29] Meanwhile, Green and Lavery remind us that monetary policies of quantitative easing are designed to increase the wealth of asset holders—those who do not rely exclusively on wages for increases in income and wealth,” disproportionately the wealthiest households in Britain. One consulting firm found in a 2014 analysis that the main effect of quantitative easing had been to increase the net worth of the UK’s richest 5 percent of households by an average of £215,000.[30]
*
In 2010, Dutch researcher, Johan Mackenbach, reflected on the 1997-2010 record by observing that reducing health inequalities “requires a massive re-allocation of societal resources,” and that “it is unlikely that a majority of the English electorate would have supported the substantial redistribution of income and wealth that would have been necessary.”[31] He concluded flatly that “reducing health inequalities is currently beyond our means,” even though pursuit of the objective should continue as a moral imperative.
Was Mackenbach right? Certainly, the 2015 election results in England would seem to vindicate his conclusion. Indeed, they suggest that in England, a decisive plurality of the electorate may be comfortable with policies that systematically redistribute income, wealth, and opportunity upward, whilst risk and insecurity are shifted downward. (The result in Scotland, where Labour and the anti-austerity Scottish National Party together won 74 percent of the popular vote, was very different.) The election result can be interpreted in at least two ways, with differing implications for health equity politics.
The first interpretation offers grounds for cautious optimism. It starts from the fact that (with Scotland as a partial exception) the election campaign offered no strong counter-narrative to the Conservative equation of economic competence with deficit reduction through selective, regressive spending cuts, even though a mainstream Nobel Prize-winning economist, Paul Krugman, was among many high-profile public challengers of the austerity nostrum. The definition of economic competence may be contested terrain, and certainly should be, but as Taylor-Gooby has pointed out in a discussion of “the Left trilemma”[32] the ability to appear to the electorate as competent in economic policy is a prerequisite for electoral success. There was no opposition effort during the election to highlight the health consequences of selective austerity, to foreground the questionable economic rationale, or to insist on the critically important recognition of public finance as a public health issue. Thus, forceful advocacy in support of reducing health inequalities, organized around the axiom “first, do no harm”—a test that current social and economic policy cannot possibly meet—might still prove effective.
The second interpretation emphasizes households’ calculations of economic and political advantage, and resembles the prescient description by former US Cabinet secretary Robert Reich of the “secession of the successful” a quarter-century ago.[33] The authors of Hard Times, the best book on the politics of responses to the post-crisis recession in the United States and the UK, posit the existence of a “constituency of the ‘squeezed but basically safe,’” arguing that “in hard times the exposed are more desperate for help than ever, but the majority… have come to calculate that it is better to throw their lot in with the haves, than to risk being saddled with tax rises to provide assistance to the have-nots.”[34] Against a background of increasing market-driven inequalities that are magnified by public policy and legitimized by official rhetoric, this political economy, the associated Chilean-style political alliance of plutocrats, and a large swath of the middle class, may prove extraordinarily resilient. The prospect of exit from the European Union after the June referendum adds further layers of uncertainty, notably about whether the working class and the marginalized will shoulder much of the cost, as seems probable if the alliance in question endures. Under those conditions, prospects for avoiding further increases in health inequalities must be reckoned as bleak.
Ted Schrecker is a professor of Global Health Policy at Durham University.
A note of apology to non-academic readers: some of the references in this commentary are to articles that are behind paywalls. If you encounter this situation, please contact the author, who will endeavour to provide a copy.
Photo: Homeless Sofa, Nick Page | Flickr
References:
[1] “Stockton-on-Tees: Health Profile 2015,” Public Health England; 2015, accessed July 11, 2016, http://www.apho.org.uk/resource/view.aspx?RID=171624.
[2] Thomas B, Dorling D, Smith GD. “Inequalities in Premature Mortality in Britain: Observational Study from 1921 to 2007,” BMJ, 2010 Jul 22, accessed July 11, 2016.
[3] Waldfogel J. Britain’s War on Poverty. New York: Russell Sage Foundation. 2010 p. 281
[4] Taylor-Gooby P. “Root and Branch Restructuring to Achieve Major Cuts: The Social Policy Programme of the 2010 UK Coalition Government.” Soc Policy Adm. 2012 Feb 1;46(1):61–82.
[5] Johnson P. “Autumn Statement Briefing: Introductory Remarks,”Institute for Fiscal Studies, 2014 April, accessed July 11, 2016, http://www.ifs.org.uk/uploads/publications/budgets/as2014/as2014_johnson.pdf
[6] Schrecker T, Bambra C. How Politics Makes Us Sick. London: Palgrave Macmillan UK. 2015. p. 167
[7] Otero G, Pechlaner G, Liberman G, Gürcan E. The Neoliberal Diet and Inequality in the United States. Soc Sci Med. 2015 Oct;142:47–55.
[8] Jones NRV, Conklin AI, Suhrcke M, Monsivais P. The Growing Price Gap between More and Less Healthy Foods: Analysis of a Novel Longitudinal UK Dataset. PLOS ONE. 2014 Oct 8;9(10):e109343.
[9] O’Hara M. Austerity Bites: A Journey to the Sharp End of Cuts in the UK. Policy Press; 2014. p. 336
[10] Real Life Reform. Real Life Reform Report 6. Sunderland: Northern Housing Consortium; 2016. http://www.northern-consortium.org.uk/wp-content/uploads/files/real-life-reform/Report%206.pdf
[11] Ashton JR, Middleton J, Lang T. “Open letter to Prime Minister David Cameron on Food Poverty in the UK,” The Lancet. 2014 May 16;383(9929):1631.
[12] Lambie-Mumford H, Dowler E. “Rising Use of ‘Food Aid’ in the United Kingdom,” Br Food J. 2014 Aug 19;116(9):1418–25.
[13] “Hard to Swallow, The Facts about Food Poverty,” Centre for Economics and Business Research, 2013 Mar. http://pressoffice.kelloggs.co.uk/download/Facts+about+Food+Poverty+ReportFINAL.pdf
[14] Butler P. “Heat or Eat? Or Take Out a Loan, Do Both, and Hope for the Best?” The Guardian, 2013 Oct 1, accessed 29 June. https://www.theguardian.com/society/2013/oct/01/heat-eat-loan-liverpool?INTCMP=ILCNETTXT3487
[15] Butler P. Food “Poverty: I was Brought Up Not to Steal. But That’s How Bad It’s Got,” The Guardian 2013 Jun 24, accessed June 29, https://www.theguardian.com/society/patrick-butler-cuts-blog/2013/jun/24/food-poverty-growth-in-shoplifting-groceries
[16] Marmot M, Allen J, Goldblatt P. “A Social Movement, Based on Evidence, to Reduce Inequalities in Health.” Soc Sci Med. 2010 Oct;71(7):1254–8.
[17] “Health Inequalities: Third Report of Session 2008–09,” UK Parliament House of Commons, 2009 Feb accessed 2016 Jul 12. http://www.publications.parliament.uk/pa/cm200809/cmselect/cmhealth/286/28602.htm
[18] Smith GCS, Pell JP. “Parachute Use to Prevent Death and Major Trauma Related to Gravitational Challenge: Systematic Review of Randomised Controlled Trials” BMJ. 2003 Dec 18;327(7429):1459–61.
[19] Taylor-Gooby P. “Root and Branch Restructuring to Achieve Major Cuts: The Social Policy Programme of the 2010 UK Coalition Government.” Soc Policy Adm. 2012 Feb 1;46(1):61–82.
[20] De Agostini P, Hills J, Sutherland H. “Were We Really All in it Together? The Distributional Effects of the 2010-2015 UK Coalition Government’s Tax-Benefit Policy Changes: An End-of-Term Update. Institute for Social and Economic Research. 2015 Sep. accessed 2016 Jul 12. https://www.iser.essex.ac.uk/research/publications/working-papers/euromod/em13-15
[21] De Agostini P, Hills J, Sutherland H. “Were We Really All in it Together? The Distributional Effects of the 2010-2015 UK Coalition Government’s Tax-Benefit Policy Changes: An End-of-Term Update. Institute for Social and Economic Research. 2015 Sep. accessed 2016 Jul 12. https://www.iser.essex.ac.uk/research/publications/working-papers/euromod/em13-15
[22] De Agostini P, Hills J, Sutherland H. “Were We Really All in it Together? The Distributional Effects of the 2010-2015 UK Coalition Government’s Tax-Benefit Policy Changes: An End-of-Term Update. Institute for Social and Economic Research. 2015 Sep. accessed 2016 Jul 12. https://www.iser.essex.ac.uk/research/publications/working-papers/euromod/em13-15
[23] Beatty C, Fothergill S. “The Uneven Impact of Welfare Reform.” The Financial Losses to People and Places. Centre for Regional Economic and Social Research, Sheffield Hallam University, 2016 Mar. https://www.shu.ac.uk/research/cresr/sites/shu.ac.uk/files/welfare-reform-2016_1.pdf
[24] Ravi Subramanian. “Proof Council Cuts Hit Poorest Areas Hardest.” 2016, accessed 2016 Jul 12. https://moreknownthanproven.wordpress.com/2016/02/16/proof-council-cuts-hit-poorest-areas-hardest/
[25] Taylor-Robinson D, Gosling R, Harrison D, Khan M, Barr B. “Austerity Measures Hit the Sickest Hardest.” BMJ. 2013 Jul 2;347:f4208.
[26] Inequality Briefing. “The Poorest Regions in the UK Are Poorer Than Anywhere in Northern Europe.” http://inequalitybriefing.org/graphics/below_EU_average.pdf
[27] “City Sicker,” The Economist, 2013 Oct 12, accessed 2016 Jun 29, http://www.economist.com/news/leaders/21587790-city-sicker
[28] Green J, Lavery S. “The Regressive Recovery: Distribution, Inequality and State Power in Britain’s Post-Crisis Political Economy,” New Polit Econ, 2015 Nov 2;20(6):894–923.
[29] Grice. “Women bear 85% of Burden After Coalition’s Tax and Benefit Tweaks.” The Independent, 2014 Dec 6, accessed 2016 Jun 29, http://www.independent.co.uk/news/uk/politics/women-bear-85-of-burden-after-coalition-s-tax-and-benefit-tweaks-9907143.html
[30] Wriglesworth Consultancy. “QE’s £215,000 Windfall for Richest 5%” Wriglesworth, 2014, http://www.wriglesworth.com/images/QE_windfall_for_the_top_5.pdf
[31] Mackenbach JP. “Has the English Strategy to Reduce Health Inequalities Failed?” Soc Sci Med. 2010 Oct;71(7):1249–53.
[32] Taylor-Gooby P. “Public Policy Futures: A Left Trilemma” Crit Soc Policy. 2013 Aug 1;33(3):403–26.
[33] Reich R. “Secession of the Successful,” The New York Times, 1991 Jan 20, accessed 2016 Jul 12, http://www.nytimes.com/1991/01/20/magazine/secession-of-the-successful.html
[34] Clark T, Heath A. “Hard Times: The Divisive Toll of the Economic Slump,” New Haven: Yale University Press, 2014. p. 311
Published on November 1, 2016.