


This is part of our special feature, Confronting Waste.
Concerns over how to handle discarded electronics as a waste stream (or “e-waste”) have been growing over nearly two decades in Europe. Almost all of that concern and the regulatory action that flows from it focuses on household or post-consumer waste. An especially potent image animating these concerns is the claim that e-waste is exported out of the region and dumped in “developing” countries (e.g., Höges 2009; The Guardian 2014). A pervasive effect of this framing is to avoid any consideration of waste arising from manufacturing electronics. This framing has the consequence of focusing action almost entirely on end-of-pipe approaches, such as recycling electronics collected from households, while leaving reduction of waste arising from the industrial production of electronics largely out of the picture.
Using the most recent available data from the Eurostat database, I show that the framing of e-waste as a question of how to handle devices discarded by consumers is highly partial and guarantees that policy interventions premised on recycling will fail on their own terms. Waste electrical and electronic equipment (WEEE) can be identified in the data available for transboundary shipments of waste using several waste codes described in documentation from Eurostat (2019d). These codes include data for transformers, capacitors, and components removed from discarded electrical and electronic equipment among other types of WEEE (Eurostat 2019d). These data reveals that e-waste exports out of Europe are a tiny fraction of the waste arising both from electronics manufacturing in Europe (Eurostat 2019a) and from households in the region (Eurostat 2019c). It is clear that manufacturing of electronics in Europe generates far more waste than does household WEEE. Even when WEEE is exported out of Europe it arrives in destinations with substantial industrial-scale materials processing industries that rely on secondary (or “scrap”) material inputs for substantial proportions of their total throughput. Even if complete compliance with systems to recycle post-consumer e-waste in Europe were achieved, such compliance would not attain sufficient scale to recoup the tonnage of waste arising from electronics manufacturing, before consumers even purchase their devices.
Imports, Exports, and Flows across Borders
The transboundary shipment data available from Eurostat shows three notable patterns. First, the predominant geography of trade is one of transboundary shipments among European nations themselves (Figure 1). This finding reinforces results obtained from different data sources in other studies of the international trade of electronic waste (Lepawsky and McNabb 2010; Lepawsky 2015). The Eurostat data indicates that the top three importing countries are the Netherlands, Germany, and Belgium. Together, these three countries receive over 78 percent of all exports from other European countries. Major secondary metals smelters operate in each of these countries. In the Netherlands, the Aldel aluminum smelter uses aluminum scrap in its feedstock to produce high-grade aluminum (Aldel n.d.). Another smelter operated by Nyrstar produces high grade zinc, zinc alloys, and sulfuric acid from primary- and secondary-resource feeds (Nyrstar 2018). Nyrstar along with Umicore operate major smelting operations in Belgium as well. These facilities also use scrap derived from electronics as part of their feedstocks. In Germany, Aurubis operates multiple facilities involved in the industrial scale processing of electronic scrap to recover copper and other non-ferrous metals (Lexis Nexis 2017; Stablum and Kayakiran n.d.; Aurubis n.d.).
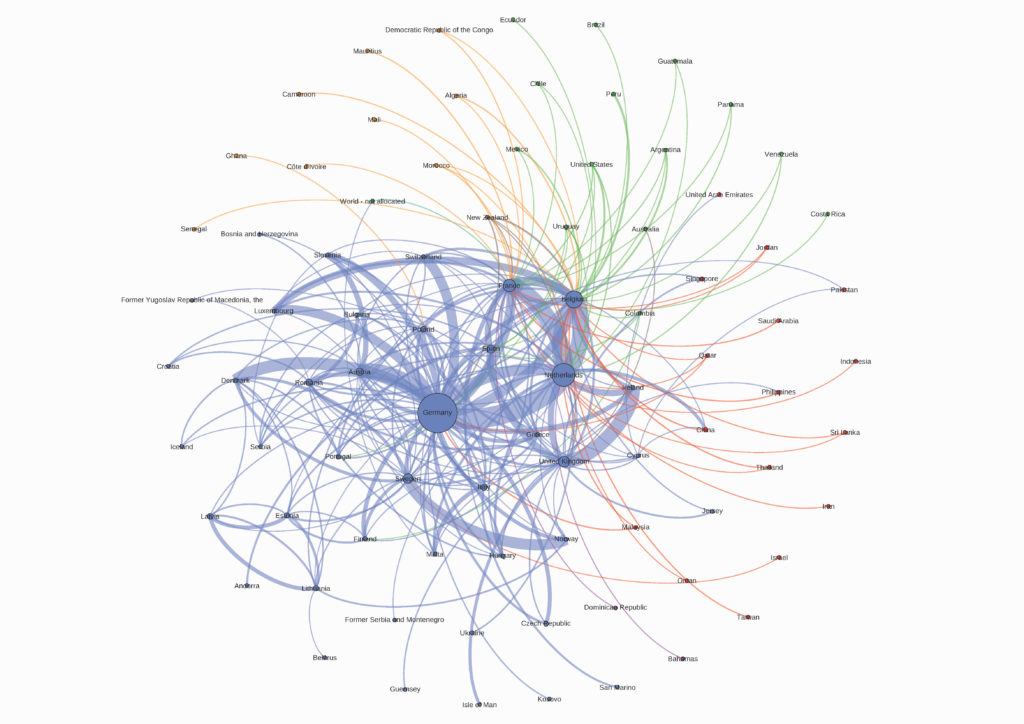
Figure 1. Total import and export flows of e-waste, 2004-2016. Color of flow lines indicate source of flows. Flow direction is read clockwise from a given source node (e.g., yellow flow lines indicate flows from African nations to European nations). Width of flows lines are proportional to tonnage of flow. Size of nodes are proportional to the total tonnage of imports and exports for a given node.
Second, a modest amount of e-waste (about 587 tons) arrives in Europe from African exporters (Figure 2). African exports of e-waste to Europe arrive in destinations with smelting capacity hungry for high-grade scrap inputs that discarded electronics can provide. Nyrstar operates a large smelting facility in Auby, France. Belgium is home to Nyrstar and Umicore smelters while Aldel and Nystar both operate facilities in the Netherlands. In Poland KGHM smelts and refines copper and other metals at its facilities at Głogów and Legnica. More could be said about these relationships, but because the dominant storyline about e-waste is focused on exports to so-called “developing” countries, I turn to a third pattern in the data that speaks to this storyline.
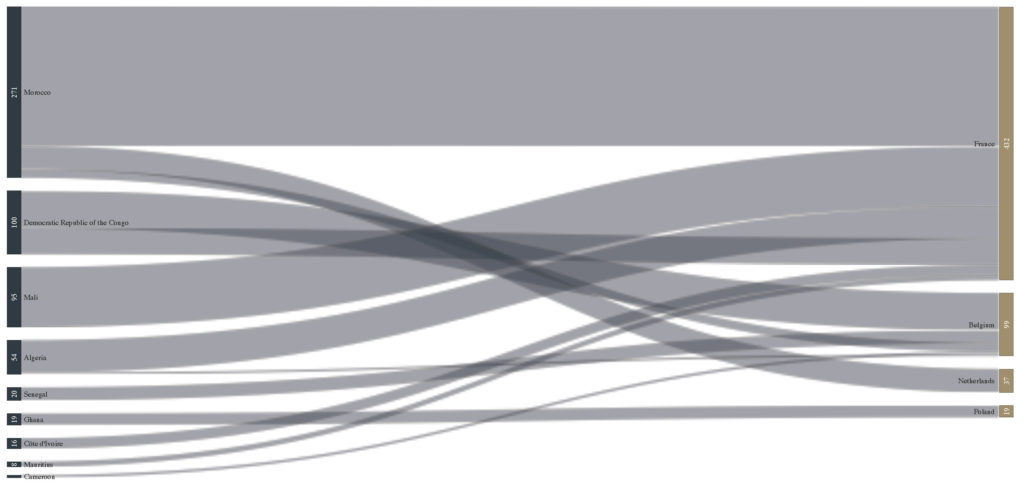
Figure 2. Total flows in tonnes of e-waste to Europe from Africa, 2004-2016.
A small amount of e-waste, 34,552 tons, leaves Europe and arrives in destinations outside the region (Figure 3). This is slightly over 2.7 percent of total exports. These export flows are destined for Singapore, China (including Hong Kong), Pakistan, Philippines, and United Arab Emirates. A small remaining amount, 188 tons, is categorized as “World – not allocated” which indicates exports out of Europe without a known destination.
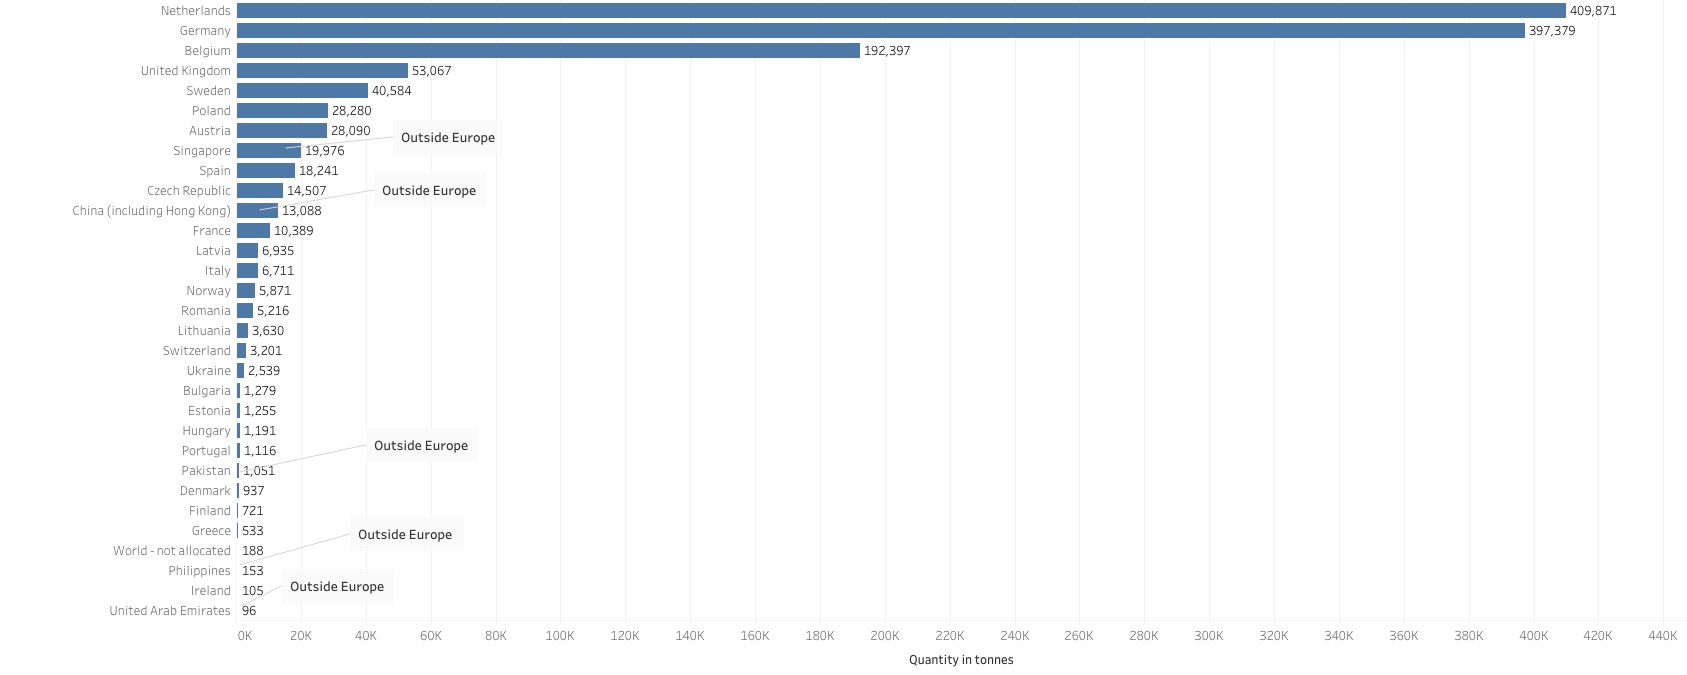
Figure 3. Export destination countries ranked by total exports received from European sources, 2004-2016. Five export destinations are outside Europe: Singapore, China (including Hong Kong), Pakistan, Philippines, and United Arab Emirates.
These are important patterns to appreciate since the dominant storyline about discarded electronics as a waste problem is that they flow from so-called developed countries to developing countries. This storyline is very prevalent in Anglophone European reportage on e-waste (e.g., Akbar 2015; Butler 2016). It is also an understanding of e-waste that drives policymaking and jurisprudence in Europe (Lepawsky 2018 Chapter 3). The usual explanation for e-waste flows out of Europe is waste dumping. That is, materials that would otherwise have to be managed at considerable expense to comply with waste management regulations in Europe are said, instead, to be exported for disposal outside of Europe in countries with weak regulation and enforcement.
While the dumping storyline has risen to the status of conventional wisdom, it runs into several problems that have not been satisfactorily resolved by those offering it as an explanation of where electronics discarded in Europe sometimes arrive. First, it is especially unlikely that European exporters would report data that, under certain conditions, would expose them to charges of illegal trade. All European exporting countries and all destination countries outside of Europe are signatories to the Basel Convention on the Control of Transboundary Movements of Hazardous Wastes and Their Disposal (the Basel Convention). Under the Basel Convention trade in hazardous waste must follow a prior informed consent process in which a recipient country agrees to take the waste prior to an actual shipment taking place. Without such consent, the trade violates the Convention. Moreover, Singapore, China, Pakistan, Philippines, and United Arab Emirates are all part of what the Convention calls “non-Annex VII” countries. All of the European exporters fall into another grouping within the Convention (called Annex VII countries) prohibited from sending hazardous waste to any non-Annex VII country. If European countries exported to non-Annex VII destinations without prior informed consent or without the presence of bilateral trade agreements that meet a threshold of environmentally sound management described in the Basel Convention, then those exports would violate the Convention even though Annex VII is not legally in force yet because it remains unratified. So, if exporting countries were trying to hide trade flows that violate the Basel Convention or European rules, they are not doing a particularly good job of it as data for these exports show up in the Eurostat database.
Second, basic economic considerations arbitrate against exports to destinations outside Europe for the purposes of environmental cost compliance avoidance or “waste dumping”. For waste dumping to be the primary driver of these export flows, a cost savings substantial enough to justify both the cost of shipping and the risks of illegal exports would have to be realized. However, a recent study specifically examining illicit e-waste exports out of Europe found that neither compliance cost avoidance nor the value that could be recouped from materials via recycling could account for the cost difference between proper compliance and shipping to export markets in Africa. The study found compliance costs to be below both material value of the equipment and the cost of export of that equipment. What could account for the difference is the reuse value of equipment discarded in Europe when sent to African markets either for direct reuse or after repair or refurbishment (Huisman et al. 2015). Discarded, but reusable electronic equipment can fetch prices in export markets twenty times higher than their value as scrap materials (Lepawsky, Goldstein, and Schulz 2015). Yet, recent attempts to surreptitiously track exports of discarded electronics from Europe and the US which find devices going to countries in Africa fail to account for the very substantial differences in prices realized in destination markets for equipment that arrives for scrap purposes verses equipment arriving for reuse purposes (as well as exibiting other serious methodological shortcomings, see Lepawsky 2017, 2018).
Third, save for Singapore, each of the countries receiving exports from Europe have their own industrial metals industries and rely on secondary or “scrap” inputs. China has, for decades, been a major importer of scrap materials for industrial production in the country. According to the latest United States Geological Survey (USGS) report on the country’s mineral industry aluminum production in China relies on secondary (i.e., scrap) sources for at least 15 percent of its annual aluminum production, about 20 percent of its copper smelting and between 40 and 60 percent of its copper refining and at least 30 percent of its annual lead production (Xun 2018, 9.8-9.11).
In Pakistan’s case, Eurostat data show the country received e-waste exports in two years, 2012 and 2016. The materials that were sent were components removed from discarded equipment such as compressors, radiators, and electric motors. These components were classified as non-hazardous based on definitions in the Basel Convention, specifically under what is technically referred to as Category B1010 of Annex IX of the Convention (Eurostat 2019b). B1010 covers a variety of scrap metals such as iron, steel, copper, nickel, and aluminum among others (Basel Secretariat 2011, 80). The United States Geological Survey minerals yearbook for Pakistan lists 24 smelters in the country producing aluminum from secondary (i.e., scrap metal) sources (Renaud 2018, 22.7). Production data are only provided for thirteen of those twenty-four smelters. However, those thirteen smelters have a total annual capacity of over 17,700 tons—a figure almost seventeen times larger than the total tonnage of imports received by Pakistan from European sources.
Both the Philippines and UAE receive modest exports from Europe, 153 tons and ninety-six tons respectively. In the past, the Philippines Metalcasting Association, an industry trade group, has claimed that, “scrap metal is the main source of raw material for local steel and metal casting industries” in the country (Recycling Today 2002); and the most recent USGS data for the country indicate annual secondary lead production in the Philippines to range between 28,000 and 34,000 tons from 2011-2015 (Fong-Sam 2018, 24.4). The USGS minerals yearbook for UAE does not offer any data on secondary metals production or processing in the country. However, Aboura Metals, a UAE based secondary metals processor claims to handle 150,000 tons of secondary non-ferrous metals annually (Aboura Metals n.d.) which means this single enterprise deals with an amount of scrap that is more than three orders of magnitude larger than the imports received from Europe.
In Singapore’s case, it is a global hub for electronics recycling operations. The city-state is a shipping cross-roads and hosts nine internationally certified electronics recycling operations, including a facility owned and operated by Australia based SIMS metal group, a major scrap metal processor with over 476 million Euros in sales revenue from electronics recycling in 2018. SIMS claims to have processed 430,000 tons of discarded electronics at 28 of its facilities dedicated to these operations in 2018 (Paben 2018; Sims Metal Management 2018a, 2018b). If that tonnage were evenly divided across all those facilities, then the single SIMS facility in Singapore could account for over 76 percent of all e-waste exported from Europe to the city-state in the six years of data available from Eurostat. With an additional eight certified facilities located in the country the remaining 24 percent of European exports to Singapore can easily be accounted for by the capacity of those other facilities.
Looking Upstream
Concerns about e-waste are usually expressed in terms of what happens to consumer or household devices at the end of their service life. Eurostat data for WEEE collected from households show a substantial growth in the mass of WEEE collected over time. The total mass of equipment collected from households rose quickly in the first few years after Europe’s WEEE Directive came into force (Figure 4). The total mass of WEEE collected from households jumped from just over 300,000 tons across Europe in 2005 to over 3.1 million tons by 2010. After plateauing for several years, the mass of collected WEEE began a further increase as a recast of the WEEE Directive came into effect in 2014, exceeding 3.8 million tons in 2016, the latest year for which data are available.
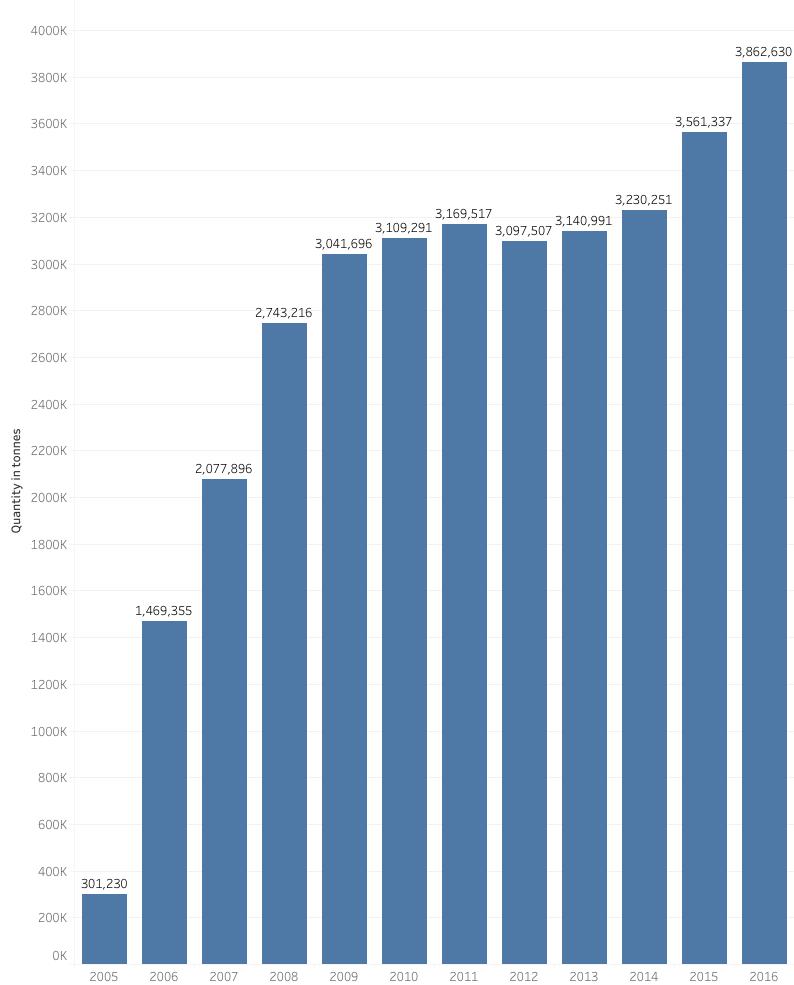
Figure 4. WEEE collected from households in Europe.
These figures may seem to reinforce the idea that household generation of WEEE is a large and growing problem. However, often left out of concerns expressed about e-waste are the wastes arising from the manufacturing of electronics. Yet, in terms of tonnage, toxicity, heterogeneity, or harms manufacturing wastes far exceed those arising from households (Figure 5). Eurostat data show that in terms of tonnage of waste arising from the manufacturing of computers and other electronic products in Europe exceeds, by an order of magnitude, household WEEE arising in any given year for which data are available. Manufacturing wastes exceeded 26.6 million tons in 2004. Since then manufacturing wastes have declined by approximately 30 percent to 18.7 million tons in 2016. Even with this decline, however, wastes arising in manufacturing are more than 4.8 times larger than WEEE arising from households in 2016 (Figure 6). Moreover, the Eurostat data give the impression that waste from such manufacturing, while large, is declining over time. But this impression is misleading because an unknowable portion of the reduction is due to the increasingly globalized dispersal of electronics manufacturing outside Europe. What looks like a reduction in overall waste arising from the sector in Europe is, at least partially, a consequence of the industrial activities responsible for it moving to jurisdictions (e.g., Asia) where comparable data reporting is limited or non-existent.
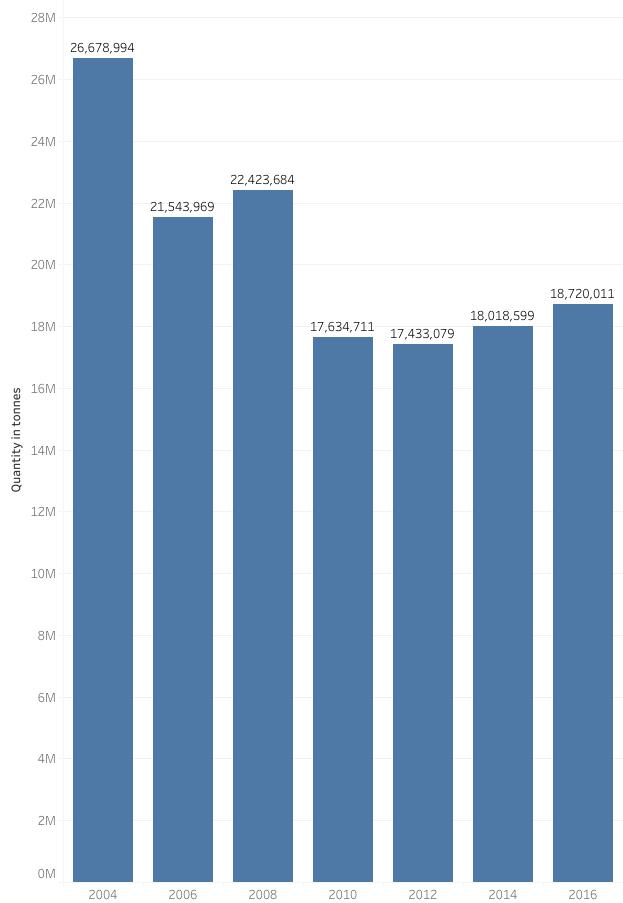
Figure 5. Total waste generated in Europe from manufacture of computer, electronic and optical products, electrical equipment, motor vehicles and other transport equipment.
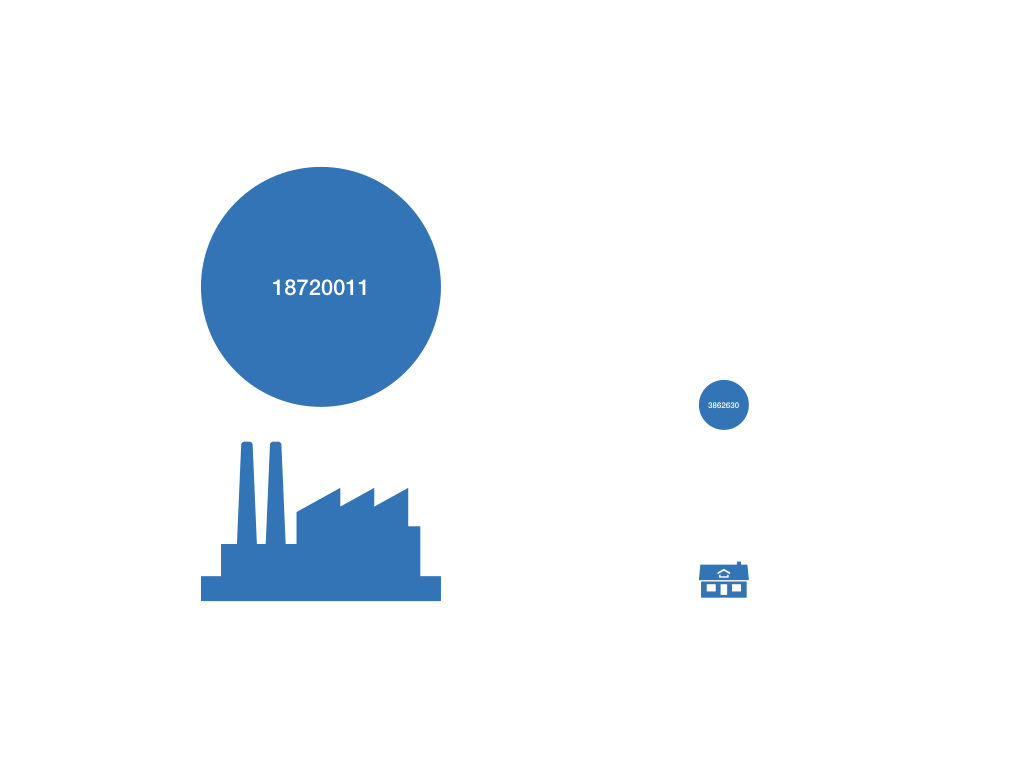
Figure 6. Comparison of scale of waste generated in manufacturing electronics versus household electronic waste in Europe. Size of icons and circles above them are proportionate to scale.
A number of broadly important issues arise from these comparisons. First, when concerns about e-waste frame the issue as a post-consumer waste issue, most of the waste arising from electronics are missed entirely. Most of the waste, by far, occurs before consumers even purchase their devices. Noticing the effects of problem framing are crucial. When e-waste is conceived as a post-consumer problem then household recycling can seem like a genuine solution. But the apparent obviousness of household recycling as such a solution is only self-evident if manufacturing wastes are bracketed out of consideration. The Eurostat data show that even 100 percent compliance with household WEEE recycling programs cannot contend with the mass of waste arising from the manufacture of computers and other electronics. Second, framing e-waste as a post-consumer problem contributes to keeping the significance of externalities of waste arising from industry invisible. In this sense, focusing on post-consumer recycling helps industry maintain its status quo ability to externalize pollution. This latter point is especially important to understand because it is industry, rather than consumers or households, that has the power to change for the better both what wastes and how much arise from the manufacturing process. No amount of post-consumer recycling can recoup wastes arising before consumers buy their devices. Moreover, through design processes industry holds by far the most sway in determining the chemistry of materials used to manufacture devices as well as the durability, repairability, and recyclability of those devices when they are eventually discarded by consumers. When making purchasing decisions consumers can choose from a wide array of device models and features. However, the underlying manufacturing conditions of those devices—from their chemical make up to the labor conditions on assembly lines—are so similar as to make the idea of consumer choice almost meaningless when it comes to being a source of power to drive change in the electronics industry.
Policy Alternatives
What interventions might be made to mitigate e-waste, given that recycling of household WEEE cannot scale to the much larger masses of waste arising from computer and electronics manufacturing in Europe? One possibility is the implementation of genuine producer responsibility (EPR) programs for electronics. In principle, EPR approaches to waste management are meant to internalize the cost of end-of-life equipment to manufacturers (Sander et al. 2007). In practice, however, EPR systems in Europe are financed by fees paid by consumers and managed by producer service organizations (which are usually non-profit industry managed organizations) that use those fees to finance take-back of equipment at its end of life. An argument can be made that consumers of a particular class of commodities, such as electronics, should bear some of the financial responsibility for the end-of-life management of those commodities. However, another effect of this financing model is that it is yet another way that manufacturers can continue to externalize those costs from their bottom line. Consequently, the “price signal” that EPR is supposed to internalize to manufacturers is negated and such systems are, in practical terms, extended consumer responsibility programs (Lepawsky 2012). Yet, as discussed above, it is consumers who have the least power to make changes upstream in design and manufacturing of devices, which are the areas that have the greatest potential to mitigate waste arising from electronics.
There are two legislative frameworks in Europe that do have substantial potential to affect waste from electronics for the better. These are the Reduction of Hazardous Substances (RoHS) legislation and the Registration, Evaluation, Authorisation and Restriction of Chemicals (REACH) legislation. RoHS is specifically directed at the electronics sector whereas REACH is much broader, extending across all manufacturing and importing sectors. There are important differences between RoHS and REACH, but they share the common characteristic of affecting the design and manufacturing of products by requiring the use of safe(r) chemicals. Neither RoHS nor REACH are intended as waste management policies per se, but they nevertheless have a profound effect on what will eventually become waste by altering how, from a chemical point of view, the design and manufacturing of electronics (and other products) get done. Moreover, because Europe is such an important market for brand manufacturers, RoHS and REACH become de facto global standards since top tier manufacturers will not incur additional costs to manufacture separate lines of the same devices to different, but lower standards for other comparable markets outside Europe.
Conclusion
The meaning of e-waste in Europe and elsewhere has been narrowly defined to designate post-consumer waste. However, waste from electronics arises throughout their entire lifecycle, from mining through manufacturing, use, and beyond. More importantly, as the data investigated here show, waste arising from manufacturing far outweighs e-waste arising at the household level. Noticing this disconnect between the scale of wastes arising from manufacturing electronics versus consuming them is crucial for several reasons. Perhaps most importantly noticing the disconnect opens up to more careful scrutiny the effects of defining a given waste in one way and not another. By constraining “e-waste” to be that which consumers and households discard, substantial effort is directed toward attempting to change what happens at the end of the pipe instead of toward changing what comes down the pipe in the first place. No amount of recycling of consumer or household waste will scale to match the mass of wastes arising in manufacturing. Nor will such recycling have any effect on how the devices are made in the first place. A consequence of this end-of-pipe approach to e-waste management is that those in the position with the most power to effect how digital devices are designed and of what they are made—industry—are provided a policy milieu that enables them to pursue their status quo interests. If, on the other hand, waste from electronics is understood to arise ubiquitously, but highly unevenly, wherever they are made, used, and eventually discarded, then it becomes clear that what needs to happen is far more action geared toward changing how that which will eventually be discarded is made in the first place.
Josh Lepawsky is Professor of Geography at Memorial University. He recently published Reassembling Rubbish: Worlding Electronic Waste with MIT Press.
References
Aboura Metals. n.d. “About | Aboura Metals.” Accessed March 14, 2019. https://www.abourametals.com/about.php.
Akbar, Jay. 2015. “Africa’s ‘electronic Graveyards’ Where the West Dumps PCs, Laptops and More | Daily Mail Online.” Daily Mail, April 23, 2015. http://www.dailymail.co.uk/news/article-3049457/Where-computer-goes-die-Shocking-pictures-toxic-electronic-graveyards-Africa-West-dumps-old-PCs-laptops-microwaves-fridges-phones.html.
Aldel. n.d. “Aldel | Product.” ALDEL – Damco Aluminum Delfzijl Coöperatie U.A. Accessed March 12, 2019. https://aldel.nl/product/.
Aurubis. n.d. “Aurubis – a Leading Global Copper Group.” Accessed November 24, 2017. https://www.aurubis.com/about-aurubis/overview.
Basel Secretariat. 2011. “Basel Convention.” http://www.basel.int/Portals/4/Basel%20Convention/docs/text/BaselConventionText-e.pdf.
Butler, Ed. 2016. “Ghana’s Electronic Graveyard, Business Daily – BBC World Service.” BBC. January 6, 2016. http://www.bbc.co.uk/programmes/p03dqslp.
Eurostat. 2019a. “Manufacture of Computer, Electronic and Optical Products, Electrical Equipment, Motor Vehicles and Other Transport Equipment.” 2019. https://ec.europa.eu/eurostat/data/database.
———. 2019b. “Transboundary Waste Shipments.” 2019. https://ec.europa.eu/eurostat/web/waste/transboundary-waste-shipments.
———. 2019c. “Waste Electrical and Electronic Equipment (WEEE) by Waste Management Operations | Waste Collected from Households.” 2019. https://ec.europa.eu/eurostat/data/database.
———. 2019d. “Waste Shipment Statistics Based on the European List of Waste Codes – Statistics Explained.” 2019. https://ec.europa.eu/eurostat/statistics-explained/index.php/Waste_shipment_statistics_based_on_the_European_list_of_waste_codes#Waste_of_Electrical_and_Electronic_Equipment_.28WEEE.29.
Fong-Sam, Yolanda. 2018. “The Mineral Industry of the Philippines.” United States Geological Survey. https://minerals.usgs.gov/minerals/pubs/country/2015/myb3-2015-rp.pdf.
Höges, Clemens. 2009. “The Children of Sodom and Gomorrah: How Europe’s Discarded Computers Are Poisoning Africa’s Kids.” December 4, 2009. http://www.spiegel.de/international/world/0,1518,665061,00.html.
Huisman, Jaco, I Botezatu, L Herreras, M Kiddane, J Hintsa, V Luda di Cortemiglia, P. Leroy, et al. 2015. “Countering WEEE Illegal Trade (CWIT) Summary Report, Market Assessment, Legal Analysis, Crime Analysis and Recommendations Roadmap.” Lyon, France.
Lepawsky, Josh. 2012. “Legal Geographies of E-Waste Legislation in Canada and the US: Jurisdiction, Responsibility and the Taboo of Production.” Geoforum 43 (6): 1194–1206.
———. 2015. “The Changing Geography of Global Trade in Electronic Discards: Time to Rethink the e-Waste Problem.” The Geographical Journal 181 (2): 147–59. https://doi.org/10.1111/geoj.12077.
———. 2017. “Precision Is Not Accuracy.” Discard Studies (blog). January 12, 2017. https://discardstudies.com/2017/01/12/precision-is-not-accuracy/.
———. 2018. Reassembling Rubbish: Worlding Electronic Waste. MIT Press.
Lepawsky, Josh, Joshua Goldstein, and Yvan Schulz. 2015. “Criminal Negligence?” Discard Studies (blog). June 24, 2015. http://discardstudies.com/2015/06/24/criminal-negligence/.
Lepawsky, Josh, and Chris McNabb. 2010. “Mapping International Flows of Electronic Waste.” The Canadian Geographer 54 (2): 177–95.
Lexis Nexis. 2017. “Aurubis.”
Nyrstar. 2018. “Nyrstar | Metals Processing.” 2018. https://www.nyrstar.com/en/about-us/operations/metals-processing.
Paben, Jared. 2018. “Sims’ Higher Earnings Came from Fewer Pounds.” E-Scrap News (blog). November 1, 2018. https://resource-recycling.com/e-scrap/2018/11/01/sims-higher-earnings-came-from-fewer-pounds/.
Recycling Today. 2002. “Philippines Proposes Tax on Scrap Metal Exports.” Recycling Today. December 17, 2002. https://www.recyclingtoday.com/article/philippines-proposes-tax-on-scrap-metal-exports/.
Renaud, Katherine. 2018. “The Mineral Industry of Pakistan.” United States Geological Survey. https://minerals.usgs.gov/minerals/pubs/country/2015/myb3-2015-pk.pdf.
Sander, Knut, Stephanie Schilling, Naoko Tojo, Chris van Rossem, Jan Vernon, and Carolyn George. 2007. “The Producer Responsibility Principle of the WEEE Directive.” ec.europa.eu/environment/waste/weee/pdf/final_rep_okopol.pdf.
Sims Metal Management. 2018a. “Sims | Annual Report.” Sims Metal Management. https://simsmetalmanagementlimited.gcs-web.com/static-files/a57b728e-2e12-4261-9671-5062db8bf047.
———. 2018b. “Sims | Sustainability Report.” Sims Metal Management. https://s3.amazonaws.com/sims-us-media/sustainability/sustainability_report+2018.pdf.
Stablum, Anna, and Firat Kayakiran. n.d. “Aurubis Melts Computers as Smelters Battle for Copper – Bloomberg.” Accessed October 25, 2010. http://www.bloomberg.com/news/print/2010-09-08/aurubis-melts-old-computers-for-copper-gold-as-smelters-battle-for-supply.html.
The Guardian. 2014. “Eyewitness: Agbogbloshie, Ghana.” The Guardian, February 28, 2014, sec. World news. http://www.theguardian.com/world/picture/2014/feb/28/ghana.
Xun, Sean. 2018. “The Mineral Industry of China.” United States Geological Survey.
Published on May 7, 2019.
Photo: Totalitarian television | Shutterstock