
Even as we ask students to examine their individual environmental choices and to review broader-scale proposals for reduction of carbon emissions, it is important to help them appreciate the degree of material commitments embodied by the Capitalocene, so that they realize the full extent of the work necessary to reconceptualize the infrastructure of the future. In Steel, their study of the global iron and steel industry, Fry and Willis insist on “the necessity of a project which forces attention on the increasingly overlooked material substrate of our everyday lives” (2015:1). In a research/mapping assignment inspired by Steel, as part of a course on resource geographies for environmental studies, students examined extractive and processing sites for major metals and realized the ubiquity of these materials. Such a task helps them fully assess the landscape impact of lifestyles characteristic of the developed world and see the dependence of “clean immaterial economic activity” on “dirty material industries” in distant locations (Fry & Willis 238).
Building on Fry’s coining of the term “sustainment” going back to 2003, he and Willis write in Steel that it is not enough to say that we want to be “sustainable:” we have to “[engage] with what we build, how we make, what we learn, and how we dwell” (2015: 4) so that we don’t just “slightly modify the impacts of something which is, in essence, damaging” (5). Overall, they think that “how, what and why we unsustainably produce our material world needs to be much better understood” (247). They suggest substituting the word “sustainment” for the word “sustainability” in order to refresh our understanding of what the latter popular concept requires from us in terms of awareness and action. Crucially, one of the things that we need to question as a result is the reliance on the information economy to give everyone jobs that don’t produce polluting byproducts; my students’ previous study of deindustrialization and the move to tertiary/quaternary levels in the economy helped them recognize Fry’s cautionary comment:
One of the political and economic features of globalization impinging on the steel industry is the growing division between the rising star of clean immaterial economic activity and dirty material industries. The former are becoming a major characteristic of advanced economies, while there is a geographic drift of the latter to the newly industrializing economies. (238)
This comment requires a greater attention to a globalized geography of resource use that does not assess ecological footprints only on a country-by-country basis. An assignment that would have students grapple with the full implications of sustainable economic development requires them to look at an integrated network of sites at different economic levels of the given industrial activity.
The concerns of Fry’s discussion track with the increased interest in the materiality of phenomena previously discussed primarily as social processes, such as urbanization. Similarly to Fry, in their study of urban metabolism, Ferrão and Fernández (2013) state that they seek to “provide the individual with informed options” (4). Their “urban metabolism models quantify the inputs, outputs, and storage of energy, water, nutrients, materials, and wastes, and may provide individuals with essential feedback on the impact of their choices” (5). They add, the trend associating development with an exponential growth of materials consumption is extremely recent (only some decades in thousands of years of human evolution). Therefore, we might not yet understand it properly. In fact, the time scale of our actions in the world is unprecedentedly fast, much faster than the time scales nature can accommodate without major perturbations in ecological systems. (5)
As a teacher, I presume that the first step towards greater understanding is awareness of the situation, including its materiality; as a geographer, I assume that an important step in this awareness is creating a map. The particular assignment discussed here, then, sought to enable students to exercise these conceptual ideas in a concrete material context. Analyzing the concepts alone would not suffice. The goal of the mapping project that I designed was to make students aware of the geographic scope of particular human economic activities (in this case, extractive mining), so that they would be better enabled to assess that activity’s connection to the lithosphere or biosphere and to assess its positionality in the global economic network.
How insights from teaching prompted the mapping project
A first and basic inspiration for the assignment grew out of an integrative project for an introductory class in Human Geography. At the end of the term, students were asked to study a single world region while synthesizing all the subdisciplinary analytical lenses from the course together with consideration of the trends in climate change for that region. In the course of supervising this project it became clear that most maps provide data primarily on a single theme, making it harder to draw inferences about interconnections between different factors; that is, in terms of the topic of this discussion, maps often exist of different mining locations, without including the locations of company headquarters or export destinations. In addition, most maps display most kinds of data by country; thus, the symbolization of the location of a mine in a particular country yields no inferences about the network of ownership in which that mine is embedded.
A second inspiration for the assignment discussed here occurred during use of the book Drawdown (2017) for an upper-level cartography class. In order to have them encounter and map positive actions to combat climate change, students were asked to choose and research one “solution” to reduction of GHG emissions from the eighty suggested in this book. The section on “Ships” (140-141) prompted further questions about shipping infrastructure. The Drawdown topic emphasized the beneficial effects on cargo ships’ fuel use of a “Greenhouse Gas Emissions Rating” system through the RightShip program; information-gathering to assess the geography and achievements of this program revealed that many of the ports subscribing to the RightShip program are used by large cargo ships transporting metals and minerals. For example, identification on Google Earth of the Brazilian Porto Sudeste do Brasil at Itaguaí, listed on the RightShip website, yielded photos of large piles of reddish minerals to be shipped, captioned as iron ore. The realization that even a highly-rated effort at mitigation of fuel use (ranking #32 in the Drawdown list) had a sizable material footprint in the background inspired inquiry into a curriculum that would help students identify and describe this reality.
Constructing the assignment using multiple sources
The metals assignment included a series of research and mapping tasks intended to help students confront the usually invisible web of resource use on which have depended and will depend not only the historical infrastructure of capitalist economies (cp. Fry and Willis 2015) but also the hoped-for infrastructure of renewable energy generation. The aim was to have students examine an integrated network of sites at different economic levels of the given industrial activity, that is, to locate and symbolize not only the sites of extraction themselves, but also the locations of company headquarters and, where possible, processing facilities. That is, in the language of the introductory course that many of them had taken, students were to layer the secondary and tertiary economic landscapes onto the primary landscapes. Of course, the primary landscapes, often open-pit mines, formed the most obvious part of the assignment: many students have never seen them, and the mines have an obvious shock value when their area is measured, since they form such strikingly visible sites; they are also obviously damaging to the environment and thus motivate investigative browsing. It was part of the goal, however, to have students realize connections between landscapes across significant distances, including the boundaries of nation-states; the additional focus on headquarters and processing facilities aimed to develop an awareness of the geographic distribution of value-adding secondary activities and of tertiary economic power centers.
Each student was assigned a major metal to research in pairs or small groups. Since we were coordinating with the book Steel and doing this project for the first time, I assigned six basic significant metals: iron, gold, silver, nickel, copper, and bauxite/aluminum. (Future iterations of the project will probably have students do the same exercise for rare earth elements or other critical metals such as molybdenum and chromium.) The stated goals were to: learn of the extraction and production process for the metal; learn the ecological impacts of the metal as a process, including water required, landscapes formed, and byproducts generated (e.g. slag); identify major companies, particularly multinational corporations, that operate or own related sites (mines, plants, or ports); locate relevant sites for the extraction and production process, such as mines, plants, and ports—and put these sites on the collective class map in ArcGIS Online. I suggested that student pairs should map ten to twelve mines each; many drew from lists found online of the top ten largest producing mines for each ore.
In order to inform their visualizations, students were advised to oscillate between multiple approaches to gather information. First, they were encouraged to use both Google Earth and ArcGIS Online to browse locations that were likely to have or known to have mining activity. Open-pit mines are incredibly visible from above; thus, if a region of mining activity was identified by another method, it was often possible to simply browse the satellite imagery in order to locate mines. Both Google Earth and ArcGIS Online often contain place names and labels that were rich with additional information to forward the research process. A particularly useful feature of Google Earth was the embedded photos. Many mines, ports, and processing facilities have a surprising number of on-site photos posted which provide site names, types of ore mined, and insight about the appearance of the landscape. Such information can confirm hunches established during Internet research or be used in search phrases in Internet browsers.
Second, students were encouraged to browse the Internet creatively, employing increasingly specific search terms although beginning with more general phrases. This method could also, of course, provide students with locational information, such as lists of mine names, mining corporation websites with lists of affiliated offices, and lists of processing facilities. Students used websites to learn more about refining processes, mining techniques, primary ores, and industrial uses for the assigned metals. In some cases, this textual research suggested other types of information which they also wanted to have the capacity to symbolize.
Third, students were counseled to do image searches for existing maps that could give them additional locational information for mines, facilities, and headquarters. Such searches also sometimes connected them to scholarly papers and reports in which the images were embedded. Maps exist for various metals and minerals primarily in isolation.
Finally, students were required to consult several peer-reviewed articles for further perspective on their metal of study. However, peer-reviewed articles rarely analyzed the full network of mines, plants, and corporate offices, so in this literature they tended to find more insight about trends in supply and end uses.
Building the exercise in ArcGIS Online
The mapping environment was created by the instructor given students’ lack of familiarity with the process of creating feature layers. Students were asked to map mines, processing areas, and corporate headquarters, that is, primary, secondary, and tertiary sites. They were also encouraged to design one additional type of information for display, although in this first iteration, none did this; some did make discoveries in research that could inspire additional visualization work in another setting.
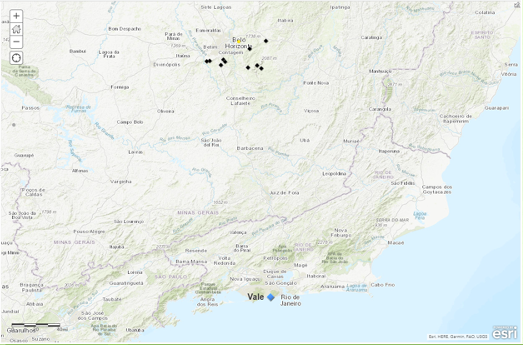
The instructor created separate layers for collective use. The class agreed ahead of time on which fields would be available for recording information and what the conventions would be for terms. In this iteration, we used primarily text strings (although in other later projects I have substituted coded numbers for simplicity). Point layers were created for mine sites as well as company headquarters so that a small-scale global display could allow analysis of broader geographical distribution by continent and region. Information entered into the layer for Mines included the names of sites, the primary ore or feedstock involved, and the owner-investor related to the site. The intent was to symbolize the six individual metals by icon type and mine ownership by color. This could not be easily achieved with the limited visualization options of “Change Style” in ArcGIS Online, so different figures show different options. In Figures 1 and 2, mines are symbolized by the primary ore in a certain color, and head office locations are also mapped by the color associated with the main ore traded. In Figure 3, iron mines belonging to Vale in south central Brazil are visually linked with the company’s head office in Rio de Janeiro by a diamond-shaped icon.
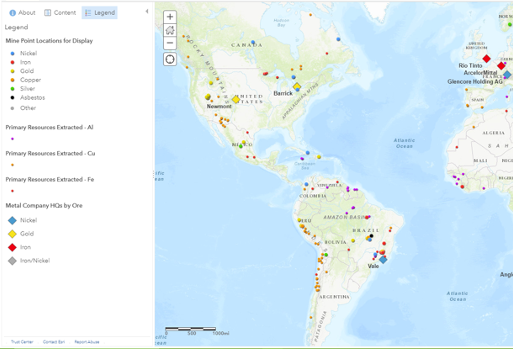
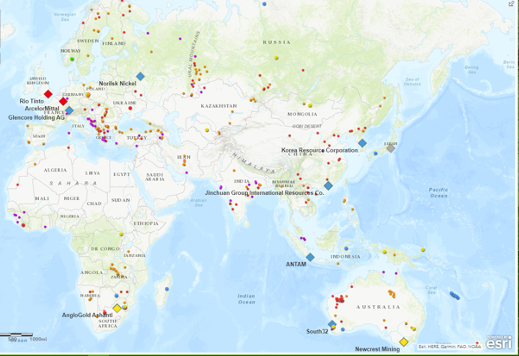
Through research, students in the class became aware of the spatial extent of mining landscapes. However, since I had only six pairs or groups, implying at most about 60-70 mine sites mapped, I have supplemented the figures here with information from another map available in Esri Living Atlas in order to convey the ultimate intended impact of producing the collaborative map. The map “Primary Resources Extracted” includes multiple elements, primarily sites for renewable resources but also showing various extraction sites. In Figures 1 and 2, “Primary Resources Extracted” has been filtered to add that map’s visualization of sites for iron, copper, and aluminum with slightly smaller dots; the larger dots resulted from my students’ work. For efficiency, my students typically chose the “top ten” mines. What becomes clear from including these other mine sites is the geographic distribution of certain kinds of mines in certain regions, such as copper in Zambia or the Andes or iron in central Brazil and Western Australia.
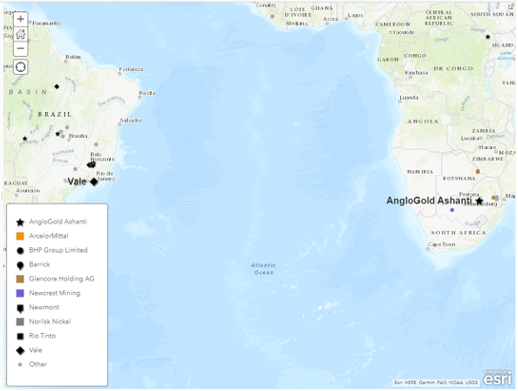
The intention was also that students would also be able to assess the supply chain structure which undergirds the dependence of tertiary economic activity on primary/secondary activity, allowing them to “[make] connections between environmental impacts across time, geographical space, multiple processes and materials” (Fry and Willis 2015: 2). Given that students had only two weeks to do this work and that some of the project infrastructure needed to be created concurrently, thus reducing productivity, this dimension of the project was weaker in this first iteration; mapping ownership across sites was not effectively visualized by the student groups, although I have tried to do so in Figure 4. There, the head office of AngloGold Ashanti in South Africa can be visually linked with two gold mines in Brazil and one in DR Congo, and the same link described above can be made for Vale with its Brazilian iron mines (although at that scale, Vale’s nickel mine in New Caledonia is not visible).
The resulting maps remain only a starting point for further development of this assignment as an ongoing project in the class as well as projects in other related classes; ultimately, the goal will be to help students reach a point where they can visualize the network of a particular ore’s distribution in different parts of the world, such as multiple large open-pit mines in Western Australia with a corporate headquarters in London and a series of steel plants in Asia. The map falls short of the eventual goal for the cartographic product—that is, a map that shows not just one thing but the interaction between several. For example, the density of open pit mines in Brazil is a less familiar story than the presence of the rainforest, and the two phenomena could be co-mapped.
As it is, students can draw some obvious conclusions, such as the clustering of mines for certain ores in certain regions, indicating geologic constraints on where they can be found; they can see the tendency of head corporate offices to be located in Europe or at least large cities, such as Rio de Janeiro or Johannesburg; and, allowing some knowledge of biome types, they can see the location of many mines in ecologically fragile landscapes such as the far north or in deserts. (The map also illustrates that the groups working on nickel, gold, and iron made the best use of the assignment.)
Insights from mapping the “substrate”
The students made discoveries for themselves that would not startle professionals, but that illuminated the geographic distribution, often in less developed countries, of primary resource extraction. Students studying copper found that its extraction dominates in South America, Africa, and Australia as well as North America; their information-gathering led them to connect Chinese investment with several African sites. Students studying iron discovered Rio Tinto’s heavy involvement with sixteen different mine sites in Australia, the company’s headquarters in London, and its history connected with both Spain and Zambia.
Students studying nickel did a particularly good job of uncovering the kinds of geographic distances and relationships involved in mining. In terms of geographic distribution, one wrote:
There are 23 countries that have nickel mines in their territories, however, the distribution of them is very unequal; Canada, China, Brazil, Indonesia, and the Philippines have most of them. The geographical distribution of the mines and processing plants/HQs shows that nickel travels as raw material to the places where it is more likely to be consumed, mostly Europe and North America. There are not very many mines in African countries; only six countries that have mines in their territories, although, South Africa alone has 23 mines. (Galvis Aceros)
The student’s partner also discovered China’s industrial dependence on nickel, likely to be affected by the plans of Indonesia to support their own smelting facilities by reducing exports of nickel to China in 2020; this could affect China’s ability to keep manufacturing related products. Further, she discovered that Japan also depends on exports from Indonesia since it has nickel processing plants but no nickel mines on its own territory (“Japan’s Nickel” 2013), although Japanese companies own mines in faraway places such as Madagascar, co-owned with companies from South Korea and Canada.
As she also noted, “The [nickel] mines in Madagascar and in Indonesia are in forested areas” (Chisholm), emphasizing the need to examine the site at large scale in order to understand its impact on the immediate landscape. As indicated above, co-mapping of correlative phenomena could reveal the broader implications of the material substrate of mining. A map of potentially damaging tailings dams could provide visual clues and information to integrate with mapped mine sites (Senra 2019) and information about hydropower projects (Sullivan 2017) could be mapped to reveal the “synergy” between mines’ need for electricity and exploitation of rivers. In fact some groups created polygons to visualize the mine sites at small scale to support possible further work in more detailed landscape analysis, such as of the interaction between mines and indigenous land claims.
Acknowledging the “substrate” in sustainment
The implication of “sustainment” is that true sustainability means using resources well within those resources’ rate of regeneration. Ecological economist Herman Daly explains such concerns in terms of the laws of thermodynamics, or conservation of mass and energy. Among others with similar concerns, he lays out the need to consider “metabolic throughput” in addition to social and political processes, because “When the entropic throughput becomes too large it overwhelms either the regenerative capacity of nature’s sources, or the assimilative capacity of nature’s sinks” (2015:7). With a rate of regeneration too long for humans to imagine, metals are a resource whose use must be carefully calibrated to their quantity and impact on landscapes.
The importance for sustainment of understanding the intricate network of mining sites is clear in light of reports such as “The Growing Role of Minerals and Metals for a Low Carbon Future” (World Bank 2017). While reduction in fossil fuel use remains the highest priority in environmental work, petroleum’s replacement by renewable sources implies yet another kind of material substrate. While Rare Earth Elements and other critical metals draw much attention in this regard, traditional major metals, perhaps especially iron and copper, will also remain critical in the construction of renewable infrastructure. For example, over the next 30 years, solar photovoltaic production will require an increased output of silver that far outstrips current annual production (at 24k tons); even consent to a four-degree increase in average temperature suggests an increase of over 150% in use of aluminum, copper, iron, silver, and nickel as well as other metals (2017:15). It is critical that dependence on this material substrate does not remain invisible as we imagine a low carbon future for sustainment.
While the intricate supply chain structures of the current global economy are likely to shift and perhaps contract as a result of the COVID-19 pandemic, the reliance of certain products on particular minerals is likely to sustain (and strain) this significant infrastructure for the foreseeable future. Even if countries like the US can increase production of strategic minerals on the North American continent and thus rely less on shipping connections, the volume of materials required for the coming renewable energy economy seems likely to require interdependence for some time.
Megan Dixon holds PhDs in Russian Literature and Human Geography and teaches at The College of Idaho. Her geography courses serve an Environmental Studies department that emphasizes both local and global place knowledge. Her classes frequently employ project-based learning in ArcGIS Online.
This essay builds on the work of undergraduate students from The College of Idaho: Kristen Chisholm, Emma Damele, Marlon Galvis Aceros, Will Gisler, Collin Glass, CeAnna Schwartz, Silas Shumate, and Mtha Tshuma.
References:
Daly, Herman. 2015. “Economics for a Full World.” Great Transition Initiative. Accessed 17 December 2019. https://greattransition.org/publication/economics-for-a-full-world
Drexhage, John, et al. 2017. “The Growing Role of Minerals and Metals for a Low Carbon Future.” World Bank Group. Accessed 17 April 2020.
Ferrão, Paulo, and John E. Fernández. 2013. Sustainable Urban Metabolism. MIT Press.
Fry, Tony. 2003. “The Voice of Sustainment: An Introduction.” Design Philosophy Papers 1:1.
Fry, Tony, and Anne-Marie Willis. 2015. Steel. A design, cultural and ecological history. Bloomsbury.
Hawken, Paul, ed. 2017. Drawdown. The most comprehensive plan ever proposed to reverse global warming. Penguin.
“Japan’s Nickel Smelters to Be Hit Hard by Indonesia Export Ban.” Reuters, Thomson Reuters, 21 Nov. 2013, www.reuters.com/article/idUSL4N0J62GX20131121.
“Primary Extraction Sites.” 2017. U-Spatial at University of Minnesota. Esri Living Atlas.
Senra, Ricardo. 2019. “Brazil’s Dam Disaster. Looking for bodies, looking for answers.” BBC News. Undated. Accessed 17 July 2020.
Sullivan, Zoe. “Unexamined synergies: dam building and mining go together in the Amazon.” 22 June 2017. Mongabay. News and Information from Nature’s Frontline. Series: Amazon Infrastructure, Global Forests. Accessed 17 July 2020.
Published on August 4, 2020.